Key points
- CBL released its FY14 results to 31 December with operating profit up 92% on FY13
- CBL Insurance Ltd performed strongly with excellent insurance ratios headlined by a combined ratio of 83.8% for FY14 (86.0% in FY13)
- CBL has largely achieved the financial performance it forecast when it issued its bonds in April 2014
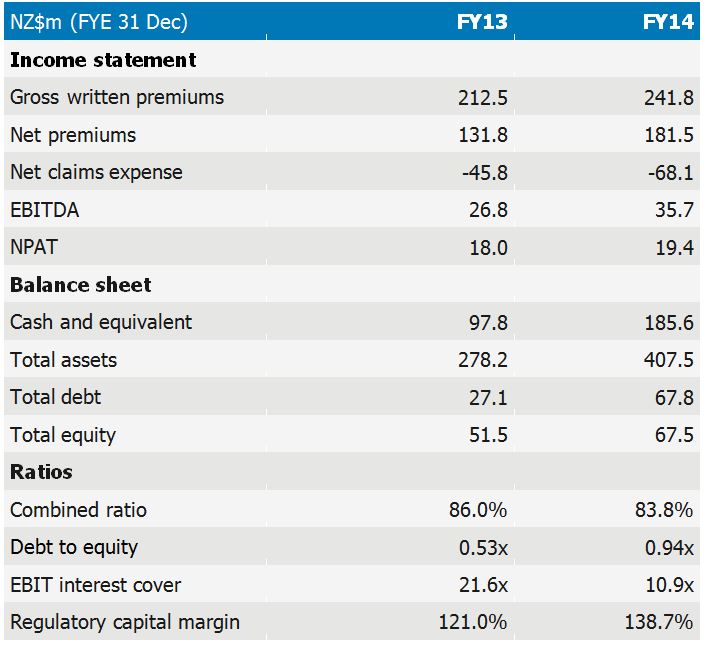
Results summary
 Source: FIIG Securities, Company presentations
- Revenue/Gross Written Premium for FY14 was NZ$240.6m up 13.2% on FY13 and on budget
- Operating profit/EBIT was up 92% on FY13 to NZ$49.6m and 7.7% ahead of budget
- NPAT was NZ$19.4m for FY14 (NZ$17.9m FY13) however this number was impacted by the non-cash unrealised foreign exchange loss (NZ$6.2m) on revaluation of the company’s assets that are predominately in €. This revaluation is required by accounting standards but importantly is unrealised (and non-cash) meaning that it will fluctuate with exchange rates on each reporting date. Removing the unrealised foreign exchange loss the NPAT would have been ~NZ$23.9m (adjusting for tax implications using a two year average tax rate)
- The main operating subsidiary, CBL Insurance Limited, performed strongly with excellent insurance ratios headlined by a combined ratio of 83.8% for FY14 (from 86.0% in FY13). The combined ratio is a measure of how profitable the insurance operations are before any investment income of premiums. 100% is breakeven and the lower the measure the more profitable the insurance operations. Most large insurers run in high 90% or even over 100% and rely on investment income from the large volume of premiums held to make a profit
- The components of the combined ratio are detailed below. The loss ratio of 40.9% includes a strengthening of current year and prior year claims reserves (removing the strengthening impact would result in a loss ratio of 33.5%). All other arrears improved, particularly the administration expense ratio which has seen the benefit of economies of scale as costs remain fairly static but on significantly larger volumes. The acquisition expense ratio relates to commissions or “ceding fees” paid by CBL to get the insurance business:
- Loss ratio 40.9% (FY13 37.9%)
- Acquisition expense ratio 34.2% (FY13 35.5%)
- Administration expense ratio 8.7% (FY13 12.6%)
- Combined ratio 83.8% (FY13 86.0%)
- The regulatory capital solvency margin improved substantially due to the reinvestment of funds from the CBL bond into capital of CBL Insurance Limited, lifting the ratio from 121.0% at FY13 to 138.7% at FY14
- AM Best rating agency affirmed CBL Insurance Limited’s credit rating in June 2014 at ‘B+’ positive outlook (equivalent to Standard and Poor’s financial strength rating of ‘A’)
- Total assets were up NZ$127.1m from YE13 to NZ$405.3m at YE14
- Total liabilities were up NZ$111.2m over the same period to NZ$337.9m
- Total equity increasedNZ$16m to NZ$67.5m
- The three balance sheet measures above reflect the AUD$55m bond issue in April (increasing debt but also the cash raised) and equity growing by the NPAT of NZ$19.4m less $2.9m in dividends paid and a small $0.4m reduction in other reserves
- Gearing and interest cover ratios deteriorated (as expected) due to the bond issue. Debt to Equity was 0.94x at YE14 (up from 0.53x at YE13) and EBIT interest coverage was 10.9x (down from 21.6x over the same period)
Overall, the FY14 results were strong and in line with financial performance CBL forecast when it issued its bonds in April 2014. The excellent combined ratio of 83.8% (and underlying loss, acquisition and administration ratios) underpin the core insurance operation of CBL Insurance Limited. The results also highlight the disciplined underwriting model of CBL which strives to write “business for profit and not volume”. This means it does not take on insurance business just for volume or take on higher risk insurance lines. The affirmation of the rating by AM Best in June 2014 also provides comfort.
For more information, please contact your FIIG representative.