In 2015 the Australian bond market marginally outperformed the ASX200, but both asset classes posted positive returns. This article summarises the markets over the last year and provides detail on the best and worst performers across both asset classes.

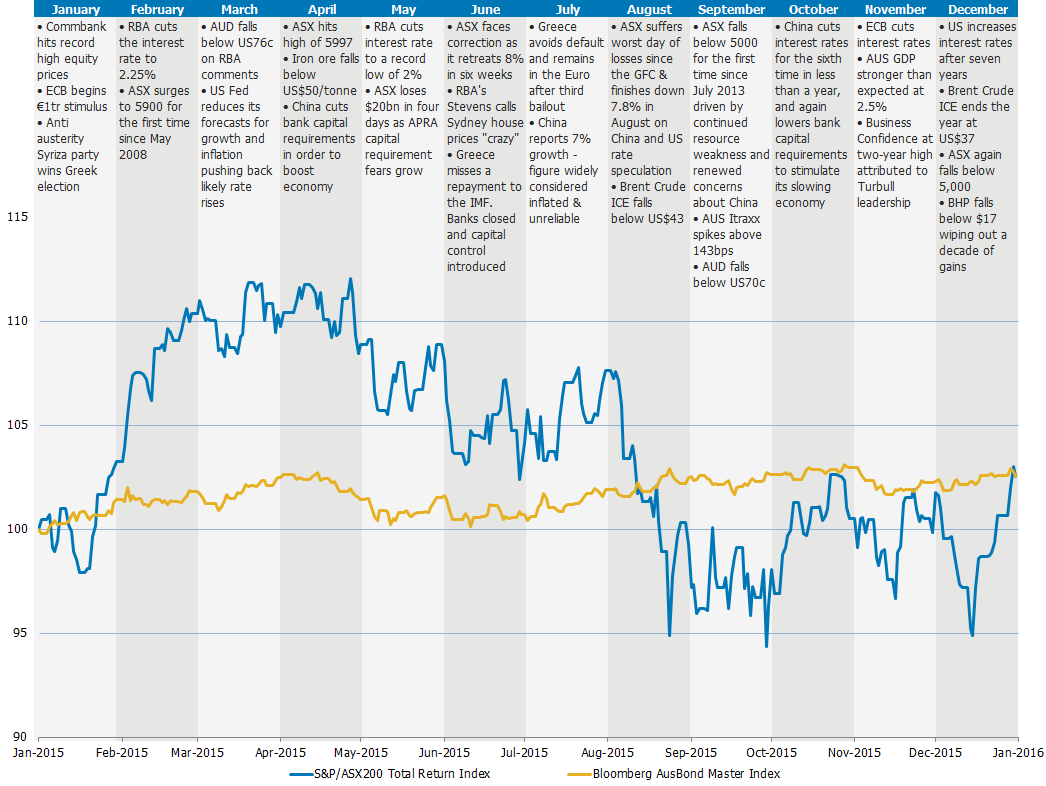
The chart below shows the performance of bond and equity markets as well as key events over 2015 (please click the image to view in full size). The graph details the S&P/ASX200 Total Return Index and the Bloomberg Australian Bond Master Index. The S&P/ASX200 Index reflects reinvestment of dividends while the Bloomberg Index captures performance of fixed, floating and inflation linked bonds. The Australian Bond Master Index marginally outperformed the ASX200 Accumulation Index over 2015 providing a total return of 2.59% compared to 2.56%. We note however that the Bond Master Index is heavily weighted (over 60%) to very low yielding government securities and high ranking investment grade entities, reflecting the size of that market. Typically, a conservative bond portfolio would target 4.5-5% while a high yield would target ~7%.

Key events
-
The Reserve Bank of Australia (RBA) cut the interest rate twice last year. The first rate cut of 25 basis points (bps) was announced in January, which boosted stock market returns at the beginning of the year. The RBA then reduced the interest rate by a further 25bps to 2.00% in May. Governor Glenn Stevens stated that the cut was needed to encourage borrowing and spending activities in the economy and stimulate an increase in household demand
- During August concerns about China’s economy as well as speculation about US interest rate increases led the ASX to suffer its worst one day losses since the GFC
- China cuts interest rates for the sixth time in less than a year, and lowered bank capital requirements to stimulate its slowing economy
- Global commodity prices slumped across the board to multi year lows amid slowing demand from emerging economies and surplus supply. Crude oil prices have fallen to ten year lows as oil producers around the world, especially members of OPEC, maintained production levels as many feared they would lose market share. Gold prices continued to ease throughout the year with declining physical demand and a stronger USD weighing on the commodity
- The Australian dollar slumped to a six year low, a level that was not seen since the GFC as lower commodity prices and falling interest rates put pressure on the value of the currency
- In December the US Federal Reserve began to raise interest rates after seven years of unprecedented accommodation
Credit spreads

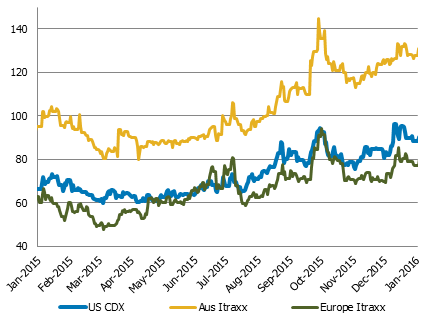
The above chart details the main investment grade credit default swap (CDS) indexes for Australia, the US and Europe. An increase in the index represents an increase in the market perception of risk.
Yields on risk assets increased through most of the year as credit spreads steadily widened. Widening credit spreads were seen in all major markets from the start of the second quarter as liquidity was tightened and debt markets anticipated the first increase in the US Fed Funds rate in almost ten years.
Overall Australian credit risk had been primarily determined by developments in China, however the heavy falls in commodity prices became the primary driver in the second half of the year as CDS spreads for iron ore and energy producers widened significantly. The five year CDS spread for BHP Billiton for example more than doubled in the second half from 78.6bps in June to 181bps by the end of the year.
Bond and equity returns in 2015
The standout income strategy of the year was to remain defensive in credit (i.e. higher up the capital structure) and relatively short (< 2 years) duration. Fixed rate bonds performed well in the first half of the year as yields declined across the globe but this all but evaporated in the second half as concerns that inflation would increase. The Australian 10 year Government Bond returned just over 4% for the year which is far better than cash and equities but was below the long run expectation of 6.0-6.5%. Overall, the performance of all domestic asset classes (i.e. absolute return) in calendar 2015 was below long run averages.
The following bond returns are generally based upon FIIG’s universe of ‘Direct Bond’ names while equity returns are taken form the ASX200.
AUD Bond returns – traded by FIIG  *Issued during the year - returns annualised
Source: FIIG Securities -
Royal Women’s Hospital recorded the largest gain of 11.5% for its senior secured Indexed Annuity Bond, as well as the number 10 spot for its senior secured nominal bond with a 7.1% return. The issuer benefited from a Moody’s credit rating upgrade in November. The higher rating was driven by a view that refinancing risk is manageable and the owners are highly incentivised to inject additional capital if needed, given the returns expected from the project
- Qantas recorded three bonds in the top 10, all returning above 10%, driven as the falling oil price and the weakening AUD greatly improving the company’s credit profile helping it to regain its investment grade credit rating by S&P
- Four FIIG led issues made it into the top 10 all returning above 7.5%; SCT Logistics, Plenary, WA Stockwell and CML group. The returns on these bonds were primarily due by the high coupon on offer
- While FIIG does not deal in listed hybrid securities (which exhibit more equity like features as opposed fixed income) we’ve included the NAB convertible preference share for comparison. It lost more than any of the bonds in the FIIG universe. The entire ASX hybrid space has fallen significantly over the year as bank share prices fell. The sale of several wholesale over-the-counter hybrids offered superior margins to their ASX-listed counterparts as well as the fact that many were expensive when issued
- FIIG led issue McPhersons recoded minor gains of 0.6% for the floating rate note and 0.9% for the fixed as an earnings downgrade saw the capital price fall below par. Cash converters was also just positive with a total return of 0.7% over the year as the company faced litigation, sector wide regulatory scrutiny and the exit of Westpac from the industry
- Other limited returns were form the Commonwealth and state governments where low returns and coupons are expected given their strong credit profile
Foreign currency bond returns – traded by FIIG

Source: FIIG Securities
-
In the foreign currency space, all the top gains were primarily driven by the high coupons on offer. In terms of the worst losses, energy and mining related companies dominated as commodity prices slumped across the board to multi year lows amid slowing demand from emerging economies and surplus supply
- We note that the returns detailed are before any foreign currency gains or losses. The weakening of the AUD would have boosted returns across this space. The USD for example appreciated around12% against the AUD
ASX200 returns

Source: FIIG Securities, Bloomberg
- Blackmores led ASX200 gains in 2015 increasing 519.4% driven by Chinese demand for its vitamins and other health products. Chinese demand also benefited other consumer products including wine with Treasury Wine Estates rounding out the top 10 by climbing 77.1% over the year
- APN Outdoor Group recorded the second highest annual gain of 140.9% as the outdoor advertising company beat its own projections and then upgraded its annual earnings outlook.
- Evolution Mining, an acquisitive gold miner, gained 130.5% on the back of its low cost production and growth through acquisition, while another gold miner, Northern Star Resources posted the eighth-largest gain, climbing 86.6%. It spent about $85m on a mine last year and a further $50m on exploration. Meanwhile, it paid off debt and tripled net profit after tax.
- Domino’s Pizza shares gained 129.2% in 2015 as the company expanded into Europe.
- Slater and Gordon suffered the largest ASX200 loss falling 86.2% after it announced its newly acquired personal injury business, for which it paid more than $1bn, was being investigated by UK regulators over its accounting methods.
- Resource companies made up more than half of the ASX200’s biggest declines in 2015. Liquefied Natural Gas lost 66.9%, as oil prices hit 10 year lows and the company experienced slower than expected signing of customers to its Magnolia project in the US. Among other energy stocks, AWE fell 61.1%, Origin Energy 53.96%, Beach Energy 53.1% and Santos lost 48.8% in 2015.