The headline unemployment rate in Australia for February was released yesterday and showed a drop in unemployment. The market reacted by boosting the Australian dollar and bond yields

Our view is that this shows too much attention being paid to the statistically misleading headline and not enough to the real employment data. Remembering that a central bank’s role is to maximise employment, not minimise the unemployment figure, while keeping inflation within the target range.
As shown below, Australia’s employment rate is deteriorating not improving:
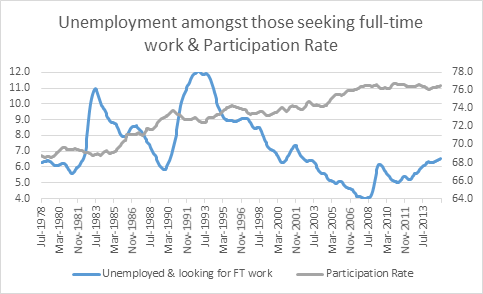
1. The unemployment rate amongst those looking for full time work is at its highest level in 14 years.
2. The average number of hours worked per worker is at its lowest point since 1992 the year of the “recession we had to have”.
On the other hand, the Australian economy has transformed over the past 25 years. So long term investors should focus on these points and not get caught up in the market’s short term focus:
3. The current unemployment rate for those looking for full time work, while at its highest level in 14 years is still around the levels of the boom years at the end of the 1980s.
4. Our participation rate, at 76.5% of the civilian population between 15-65 years of age, is 10% higher than it was in the 80s. This means we have access to an additional 1.5 million workers today when compared to the past participation rate.
Yet again, we are reminded that financial markets are driven by professional traders such as: those trading bank balance sheet capital, hedge funds and some fund managers. For investors, the key is to take a few steps back and look at the fundamentals. For Australia’s economy, yesterday’s data shows a slight deterioration, not an improvement, but nothing to be alarmed about as our economy remains fundamentally healthy.
We maintain our view on the outlook for the next few years that Australia needs a lower dollar to ensure that industries like education and tourism can continue to boom and take advantage of the strong half of the Chinese economy – their consumers.
Rate of people looking for full time work and unable to secure this(“Unemployment rate – looking for full time work”)
Contrary to headline unemployment rate, when we look at the bulk of the labour force (namely the 15-65 year old population) the unemployment rate has been steadily rising over the past 2 years. From 5.7% to 6.6%, with February’s result the worst since March 2003. As shown in the chart below, the trend is worsening and should be closely watched over the next few months as the construction cycle weakens. The RBA will be watching this data rather than the headline unemployment rate.
Participation rate
Again looking at the 15-65 year old group, the participation rate – those employed or looking for work - remains strong. This is also contrary to the headlines released yesterday, which were clouded by short term statistical noise. The current reported participation rate is well above levels recorded 20 years ago, largely driven by more women entering the workforce.

Utilisation of labour
The number of hours worked per day is an indication of the utilisation of Australia’s labour force the health of the economy. The RBA’s role is to increase this ratio, and so as long as it is falling, they will have an easing bias which means lowering rates.

To learn more about our view on the year ahead, download the 2016 Smart Income Report produced by Craig Swanger and the Research team.