The median FIIG client received a 9.08%* rate of return net of fees, proving it’s been a good year for bond investors. With FY25 now behind us, we look at the returns FIIG clients received from their bond portfolios and the ways in which better returns were generated in this article.
Overview
Annually, as part of the FIIG service offering, FIIG clients receive a Portfolio Review along with a breakdown of their overall portfolio returns. It’s helpful for clients to assess if their bond portfolio’s risk-reward still meets their investment objectives. This also provides further insight into how their portfolio is performing across other asset classes.
For a portfolio to be included in the analysis, it must have at least five or more bonds, have a portfolio holding of at least AUD 250k, and the bonds must have been held for at least six months. It’s also worth noting that the returns shown are for illustrative purposes, as past returns aren’t a guarantee for future returns.
Bond Portfolio Returns
Overall FIIG clients achieved attractive returns, while also receiving a stable income from their bond portfolios. As mentioned, the median FIIG client received a 9.08%* rate of return - net of fees, while the median rolling 3-year and 5-year return was 8.09% and 6.62%, respectively. This compares to equity markets, which were up (ASX200 Accumulation up 13.64%), and property markets which performed poorly (Australian Capital City Property Index falling to 3.1%, down from 8.0% for FY24).
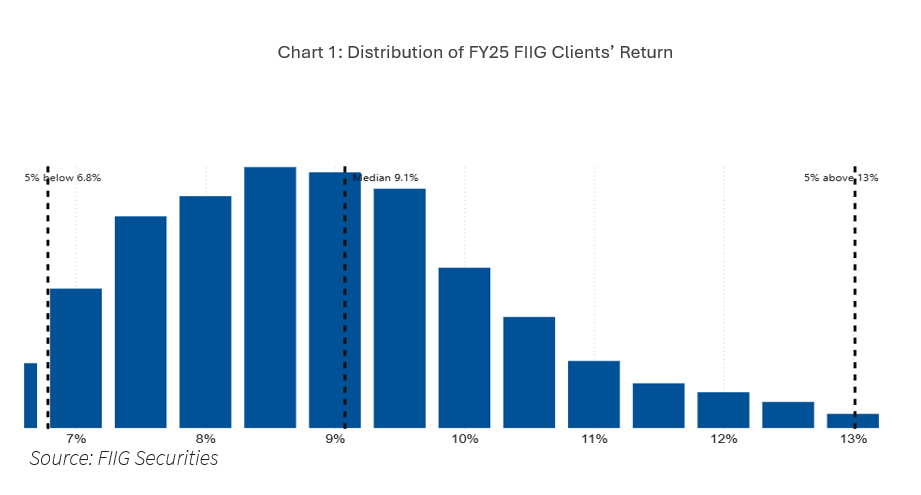
Across the FIIG client base, 99% of investors received a return above 5.8%, as shown in the graph below. These returns are compelling, even when compared against the Bloomberg AusBond Composite Index, with a return of 7.18% annualised (noting this index has a larger weighting to government and semi-government bonds compared to the FIIG client portfolio). This illustrates that better returns can be achieved when holding a fixed income portfolio directly, rather than through a managed fund, among other advantages (which we discuss in this article).

The chart shows the distribution of returns for clients falling within 6.8%-13% in FY25. This range reflects 90% of client returns and is intended only to provide a view of the typical client experience. Accounts outside this range were excluded to remove the statistical outliers and to help protect the privacy of clients whose portfolios may be uniquely structured or identifiable. Past performance is not a reliable indicator of future performance.
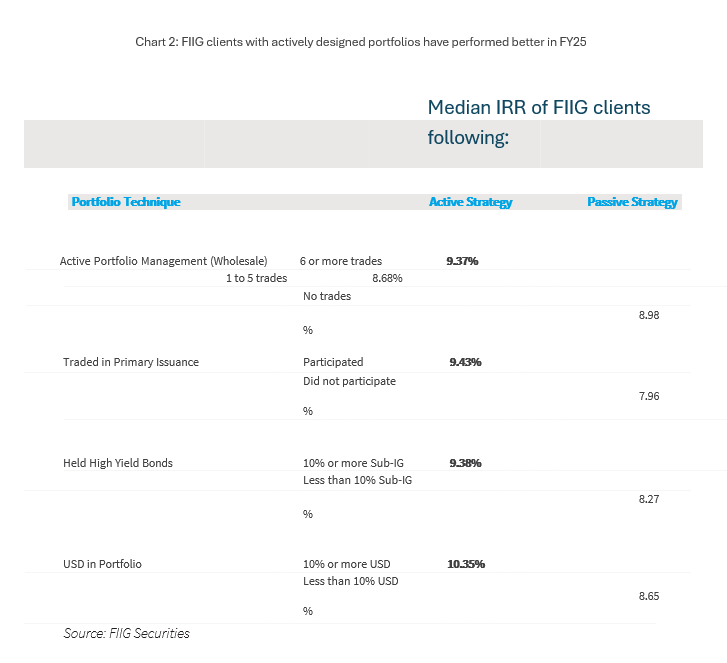
When further analysing the returns across the FIIG client base, better returns were achieved when portfolios were actively managed, participated in new issues, and held an allocation to non-AUD bonds as well as high yield bonds. A breakdown of these return comparisons is shown below and shows how an improvement in returns were achieved with these four strategies, noting that returns were also bolstered by favourable market conditions.

The Reserve Bank of Australia (RBA) kept the cash rate steady at its high of 4.35%, noting it hasn’t been this high in over a decade, for most of FY25 and cutting the rate only twice towards the latter half of the year. Despite this, the Australian Government 10-year bond was flat over the year, starting the year at a yield of 4.17%, and closing FY25 at 4.18%. Higher yields, along with credit spread tightening, also assisted bond investors, and FIIG clients alike, achieve better returns over FY25. Here we further discuss the six factors that helped improve returns over the year.
How to achieve better returns
Firstly, as mentioned, bond yields are higher than they have been for a while, which has provided portfolios with a foundation of solid yield returns from interest rates. The average yield on a FIIG portfolio is 5.80%, generating a stable return for a fixed income investor, and this year the median FIIG client earned 9.08%- which easily outstrips returns from interest rates alone. As we enter further into the RBA’s rate cutting cycle into the 2026 financial year, we’re unlikely to see yields remain elevated in the short-end of the curve, although likely ongoing tariff discussions and US fiscal needs will see yields in the longer end up. This steepening yield curve will provide more attractive yields across bonds with a 7 to 10-year maturity profile.
Second, credit spreads have been tightening, causing gains for bond holders. The overall structure of the bond curve in FY25 saw high Government bond yields all along the curve, but most FIIG investors chose to invest in corporate bonds, which have higher yields thanks to the spread between Government and Corporate bonds. When credit spreads tighten, the corporate bonds drop in yield and experience capital gains.
Third, returns are much higher for FIIG clients who actively trade. Active trading allows investors to capture short-term opportunities in the market, noting there are costs involved for each trade. Although balancing the cost with the opportunity is important. FIIG clients who actively traded their portfolios over FY25 achieved a higher median return of 9.18%, compared to passive portfolios, which achieved a median return of 7.85%.
Fourth, FIIG clients who participate in primary issues see higher returns. There is usually a “new issue premium” where bonds have a higher yield at first issuance than other comparable bonds. Moreover, when a bond is advertised as yielding 6% for five years, it might be tempting to think of that as 6% each year, for five years. That’s not exactly what happens. Instead, the returns are normally front-loaded. Because of positively sloped curves, credit roll-down, and new issue premium, bonds normally earn more early in their life than later. Consistently recycling your investment into newer bonds creates positive returns and allows returns to consistently exceed the yield on the portfolio.
Fifth, investors who allocate a portion of their portfolio to high-yield investments tended to see higher returns. High-yield is a category that includes the low-rated tranches of ABS and RMBS deals as well as more traditional bonds rated below investment grade. FIIG clients who held an allocation to sub-investment grade bonds were rewarded for the additional risk, generating a return of 9.38%, compared to those with zero or minimal holding sub-investment grade holdings, achieving a return of 8.27%.
Six, currency diversification was a key contributor to returns. Clients who allocated a portion of their portfolio to foreign currency assets experienced good returns. For example, the median return for investors with USD in their portfolios was 10.35%, but only 8.65% for those with zero or minimal USD holdings.
The vast majority of FIIG clients, particularly those who have actively managed their portfolios, have generated strong outperformance over the benchmark in 2025. With ongoing volatility and a lower cash rate expected, bonds continue to offer a predictable income and a way to generate better returns for the year ahead. We encourage you to reach out to a Fixed Income expert to find out more.
*Please note: past performance isn’t a guarantee of future returns. FY25 returns shown are for illustrative purposes.