In FY15, the Australian equity market outperformed the bond market, but both asset classes posted positive returns. This article provides more detail on the best and worst performers of the last financial year across both asset classes

In FY15, the Australian equity market outperformed the bond market, but both asset classes posted positive returns. Quantitative easing and low interest rates supported bond returns while the decline in the commodity sector hampered equity markets. Gains in equities were almost half that of the prior two years of double digit growth.
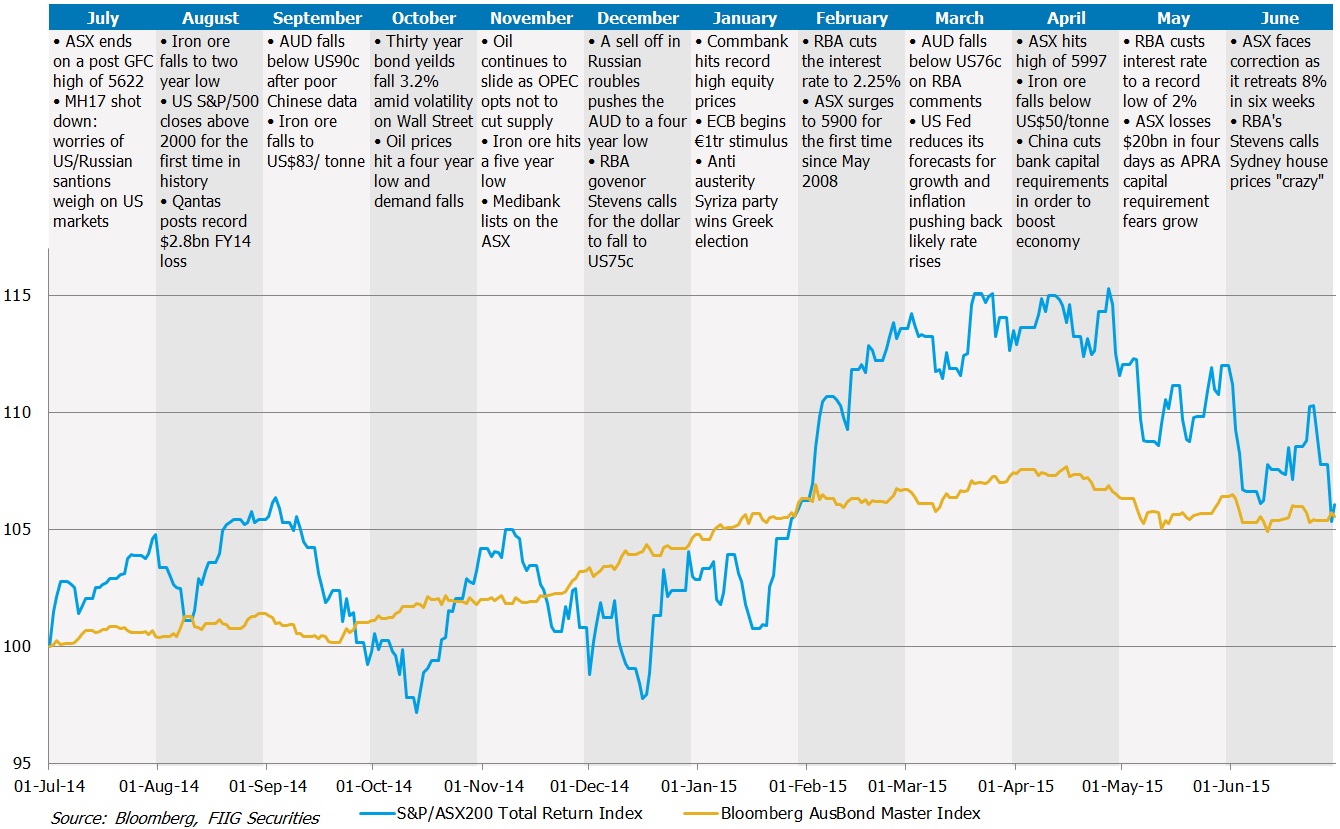
Bond and equity market performance as well as key events over the last year are shown in Figure 1. The graph details the S&P/ASX200 Total Return Index and the Bloomberg Australian Bond Master Index. The S&P/ASX200 index reflects reinvestment of dividends while the Bloomberg index captures performance of fixed, floating and inflation linked bonds. Over the year, shares returned 6.07%, just ousting bonds which returned 5.53%.
Australian financial markets FY15

Figure 1
Most of the bond gains were between September 2014 and March 2015, as ECB QE and tumbling commodity prices sparked deflationary fears. This, along with softening Australian data drove the market to price in multiple RBA rate cuts which further aided fixed rate bond price increases.
The Australian stock market was restricted by significant falls in commodity prices with the ASX200 gaining only 1.17% over the year or 6.07% taking into consideration dividends as illustrated by the Total Return Index. The ASX200 traded sideways for the majority of the year until the start of CY15 where further stimulus measures drove the index to a post GFC high of 5,997. This rise was short lived as a decline in major global markets triggered an ASX correction with an 8% fall in six weeks.
The difference in volatility between the markets is illustrated in the graph with massive return swings in equities when compared to the more steady progress of the bond index. This reflects the nature of bonds - lower risk in the capital structure when compared to equities and therefore displaying better consistency of returns.
The best and the worst AUD investments
ASX200 returns were volatile, with individual company returns ranging from gains of 150% to losses of 80%, while bonds experienced gains of 20.42% to losses of 1.16% with mostly positive returns even in the worst performing (see Table 1 for the best and worst performing AUD bonds in the FIIG universe and ASX200 equities).
AUD bonds and ASX200
Table 1
Source: Bloomberg, FIIG Securities
Qantas was on the top ten performer’s list for both shares and bonds. It’s return to profit on the back of cost cutting and lower oil prices helped boost its share price to a seven year high, returning 150% in the year and putting its three domestic bonds into the top 10 list.
The collapse in oil prices however, also drove significant losses with companies such as MMA Offshore, Senex Energy and Santos making the worst 10 performers of the ASX/200 list, down a significant 45% or more. Unsurprisingly, miner Arrium suffered the largest ASX200 loss of 80% after recording a $1.3bn impairment as iron ore prices tumbled.
In the fixed income space this year, Inflation Linked Bonds (ILBs) performed strongly as investors sought exposure to infrastructure assets and limited supply helped push the price of the bonds higher. RMBS also performed well with three securities making the top 10 list.
Highly rated fixed rate bonds mostly rounded out the ‘worst’ performing bond list consummate with the lower risk, lower return relationship, although most of these still had an overall positive return for the year. This list mostly contains very highly rated bank or financial institution bonds.
The best and the worst foreign currency bond investments
The top three best performing foreign currency bonds earned more than 30% in the last year, combining the return on the bond itself and the impact of currency moves. If the currency moves are taken into account, nine of the ten bonds returned over 20% (see Table 2).
Foreign currency bonds - traded by FIIG
Table 2
Source: Bloomberg, FIIG Securities
Note: Calculations are based on the spot price at the start and end of the year, and the annual average price being used to calculate coupon returns.
The significant decline of the AUD when compared to the USD and the GBP helped boost the total returns of related securities meaning the best performing returns were driven higher and only the top three worst performing were in an overall negative position.
Newcastle Coal took out the top spot returning 35.68% driven by improvements in its credit profile and a high running yield and an amazing 57.71% when taking into consideration the appreciation of the USD compared to the AUD. Unsurprisingly, resource companies recorded the largest declines with the fall in commodity prices and subsequent decline in mining and mining services driving declines in credit quality.