Australia’s unemployment rate was published yesterday, surprising markets with a 0.3% drop to 5.9%. The new job creation is good news, albeit tainted by the credibility issues that have plagued unemployment data for the past two years

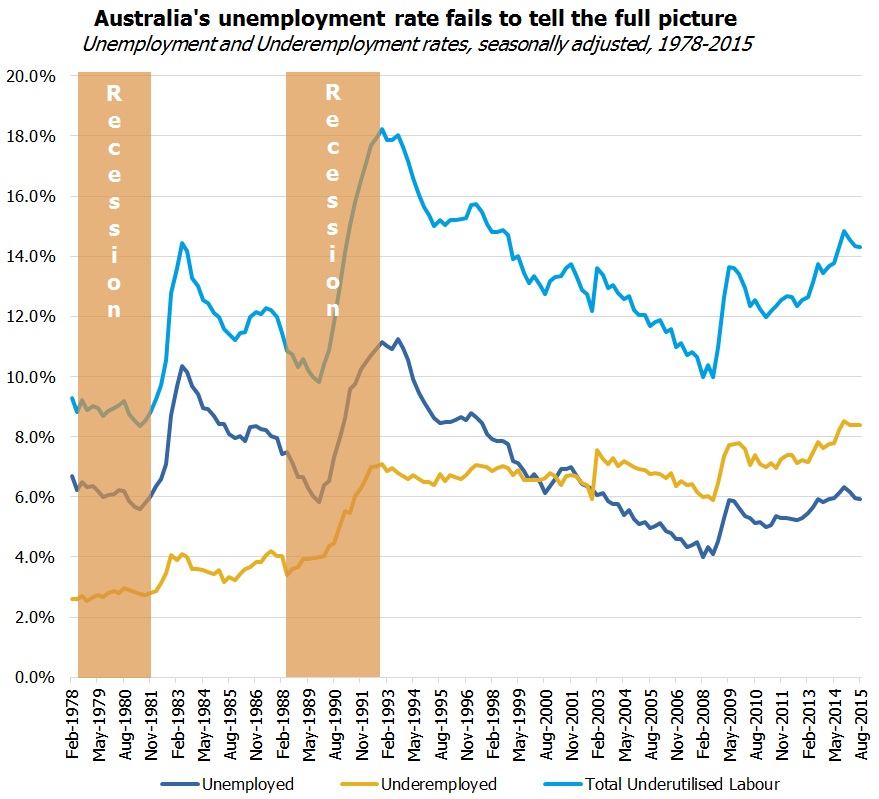
Two months ago we put out a report on “underemployment”, highlighting the flaw in the unemployment rate as a driver of the RBA’s likely direction on interest rates. The RBA’s mandate is to maximise employment while keeping inflation in the target range of 2-3%. Maximising employment does not mean minimising the number of people completely unemployed. It means maximising the hours worked relative to how many hours the labour force wants to work. The difference that is not captured in the unemployment rate is those people that want more hours, e.g. they want full time work but can only get part time work.
This data is collected in Australia, but it isn’t picked up in the headlines. In our previous report, we showed that the rate of “underemployment” is currently at a record high.

Source: FIIG Securities, RBA
This data is only collected quarterly, so we can’t see whether it has improved since August this year, but another way to view this issue is using the average number of hours worked per person in the labour force. This doesn’t take into account those that don’t want to work more than they are, so it isn’t as accurate. We’ve used males only for this chart as the return to the workforce of part-time females has been a trend over the past 40 years that would otherwise make the chart look much worse than it already does. As you can see from the below chart, the average hours worked per month per male in the labour force is still at recessionary levels, despite the pickup in October. We have seen these spikes on 2 or 3 occasions since the GFC, but they haven’t been sustained.

Source: FIIG Securities, RBA
Conclusion
The jobs created in October are good news, assuming it isn’t revised downwards in later reports. But the reaction by several economists to suddenly change their forecasts about the RBA’s interest rate changes over the next few months seems to be a knee-jerk reaction. The data is unreliable and so the trend over several months is the key. If November and December data shows there is a positive trend forming, that is the time to revise forecasts on rates. Until then, underemployment in Australia remains at very high levels typically only seen in a recession, which considered in the context of record low global interest rates; a slowing China; an overvalued AUD; and the increasing likelihood of a housing market slide in Australia, suggests that RBA lowering of interest rates is still the most likely scenario.
For those with cash to invest in bond markets, the good news is that this overreaction by the market has pushed up rates on offer. The ten year government bond yield is at 2.94%, up 24bp this month. This shift is likely to reverse on the next piece of weak data out of China or Australia, likely the new home sales or construction data due out late November.